What makes a corner look like a gas station site?
Ranking every corner parcel around Austin by how much it resembles the places convenience stores with fuel actually get built.
Most site searches start the same way. Someone thinks of a few corners they already know, then opens their favorite mapping tool and starts searching around. That works, but it runs mostly on eyeballs and intuition, and it only covers the corners someone happens to look at.
I wanted the opposite. Start with every corner in the five-county Austin area, Travis, Williamson, Hays, Caldwell and Bastrop, and let the data narrow it down to the corners that would work well for a gas station.
The goal (and what it isn’t)
Let’s be clear about the target up front, because it shapes every decision after it.
The goal is a good shortlist of corners that would work well for a gas station. It isn’t to pick the single best corner in Central Texas.
That distinction matters. A site on this list might get a closer look, but nothing more is on the line at this point. If a site turns out to be a dud, that’s a few minutes wasted. If a great site never makes the list, nobody ever looks at it. So the job is to put the plausible sites near the top and the poor ones far down. Getting the exact order of the top 50 right isn’t the job, and I’ll show later why the model can’t do that anyway.
There’s a second reason not to chase extreme precision. The thing I’m learning from is black and white: did a fuel station appear on this corner, or not? “Not” covers a lot of ground. A corner can be excellent and still empty because:
- The owner doesn’t want to sell.
- It’s tied up in an estate, a family partnership, or a long-term lease.
- The zoning, utilities or a deed restriction got in the way.
- Nobody has gotten around to it yet.
An empty corner isn’t a bad corner, it’s an unknown one. Those unknown corners are the interesting ones.
Texas publishes where fuel tanks go in the ground
I don’t have sales data, so I can’t say which corner would sell the most gas. What I can ask is narrower: which corners look most like the places developers have already chosen?
The answer starts with the Texas Commission on Environmental Quality. TCEQ keeps a registry of petroleum storage tanks, with install dates and site addresses. Every new station has to put tanks in the ground, so the registry gives a record of where stations were built and when.
The catch is the one above. The registry shows where developers said yes. It never shows where they said no. So rather than treating every empty corner as a bad example, the model treats them as unlabeled. This is known as positive-unlabeled learning: you learn from confirmed positives and a pool of unknowns, without pretending the unknowns are negatives.
Finding the corners
Next, the haystack. Starting from every appraisal parcel in the five counties, I found every parcel that sits on an intersection, about 43,500 of them. Then I filtered for the basics a station needs before ever looking at traffic or demographics:
| Rule | Corners left |
|---|---|
| Corner parcels | 43,464 |
| At least 1.5 acres | 16,721 |
| Room for a driveway on both roads | 8,103 |
| No retail fuel tanks already on record | 7,975 |
| Mostly unimproved land | 4,048 |
| A store-sized pad can be formed | 3,821 |
| Pad outside the Edwards Aquifer recharge zone | 3,477 |
| Enough buildable land outside the floodplain and ponds | 3,231 |
| Pad holds a usable block of land | 3,045 |
| Not already heavily paved | 2,849 |
A few of these deserve a word.
Driveways. A c-store generally wants an entrance on both roads. Whether that’s possible depends on how far a driveway must sit from the corner and from the next driveway along the road, and that distance grows with road speed. I borrowed TxDOT’s access spacing standards and applied them to every road as a stand-in. It’s a screen, not a permit answer, but it throws out a lot of corners that would never work.
Big parcels. Most good corners sit on tracts far bigger than a store needs. Rather than score the whole 40 acres, the screen carves a store-sized pad at the corner and checks the pad itself for frontage, floodplain and paving. Those sites get flagged as needing to be subdivided.
Floodplain and water. FEMA’s special flood hazard area is measured on the pad, not just the parcel. A corner that’s half floodplain can still work if the dry half is the half you’d build on. Ponds and stock tanks come off the buildable area the same way, using mapped water from Overture Maps and the USGS.
A usable block. Some parcels add up to plenty of acres without holding anywhere to build: a road right-of-way recorded as its own parcel, or a lot riddled with holes. So the pad also has to keep a solid core when it’s shrunk 60 feet inward from every edge.
Teaching it what a station site looks like
With the corners in hand, I measured the surroundings of each one: traffic counts, road type and speed, people, jobs and buildings within a short drive, recent growth, and existing competition. The sources are public: TxDOT traffic counts, Census and LEHD employment data, NLCD land cover, Overture Maps building footprints, and OpenStreetMap roads.
Traffic counts needed the most help. TxDOT counts the highways well but very few city and county roads, which is exactly where a lot of corners sit. So I borrowed a trick from regional travel planning: take the public records of where people live and where they work, and route those commutes over the road network. That gives every road a relative commute volume, including the ones nobody has counted. It also shows which side of the road carries the evening drive home, when people are most likely to stop.
Then two scores.
- A trained model. An ensemble of gradient-boosted trees, trained many times over on the confirmed stations and fresh samples of the unknowns. It learns its own weights, thresholds and combinations. It’s the more accurate of the two, but it doesn’t reduce to a simple formula.
- A hand-built score. A weighted checklist of the factors I’d expect to matter, plus the parcel factors the model never sees, such as land value and pad size. Where a road has no traffic count, it uses an estimate built from the commute routing. It’s easy to explain. It’s also built on my assumptions.
The shortlist blends the two, weighted mostly toward the model.
One detail took more care than anything else. Existing stations have buildings, pavement and lots sized for a store. Give a model those details and it learns to recognize existing gas stations, which is useless. That’s data leakage: the answer sneaking into the inputs. So the model only sees a corner’s surroundings, never the parcel itself.
Testing it on the future
A model that only describes the past isn’t worth much. So I tested it the way it would actually be used.
I trained on stations built from 2006 through 2017, using only data from before each one was built. Then I froze everything at 2018 and checked where stations built in 2019 or later landed in the ranking. This is a temporal holdout: the model never sees the future it’s being graded on.
The main measure is recall at the top 10%: of the stations that actually got built, how many were in the model’s top tenth of corners? A random ranking would catch about 10%.
Among corners where a station could realistically go, the model caught 46% of later builds in its top 10%, and 75% in its top 20%. Ranking by traffic alone caught 21% in the top 10%.
Is it perfect? No. That result rests on just 28 stations, and the plausible range runs from about 30% to 64%. That range already allows for stations clustering in the same growth areas, which would otherwise make the evidence look stronger than it is. But it does the job it was built for. It separates corners worth a look from corners that aren’t.
Two checks keep that honest. First, is the model just picking the bigger road? Among realistic corners, ranking by road type alone caught 11%, no better than chance, so the model is doing more than that. Second, does the very top of the list hold up? Of the 28 later stations, 2 landed in the model’s top 50 and 4 in its top 100, out of about 3,900 corners. Chance would put less than one in each. That’s well above chance, but it’s two and four stations. It’s enough to trust the list as a set worth a closer look, not enough to trust the order within it.
To firm that up, I repeated the test over three periods: stations built 2011–2015, 2016–2018 and 2019 onward, each ranked using only the data available before it. That brings the count to 48 stations. Across all three, the model’s top 10% caught 44% of later builds. Before the commute and building data were added, the same test caught 33%. The ranges still overlap, so it’s a meaningful step, not a proven one.
One more caveat, and it’s the one a careful reader should weigh most. I looked at these test results while I was building the project, and I kept changing rules and features along the way. Every change was made for a reason I could defend, but each look at the test makes it a little less of a test. So the numbers above are probably somewhat flattering. The fix is simple: I froze the ranking when I published this. Stations built after that were never seen by me or the model, so in a year or two they’ll give a clean grade.
What I learned
Which corners you grade on changes the grade. Score the model against all 43,000 corners and it catches 69% of later builds in its top 10%. That sounds great, but the full set includes thousands of corners that are easy to rank low, and those pad the score. Grade it only on corners where a station could realistically go and it drops to 46%. That’s the number that matters, because those are the corners you’re choosing between.
It can’t pick between two good corners. Where both roads were already busy, the model’s top 10% caught 28% of later builds. A random ranking should catch about 10%, but in this small group a random check caught 16%, which shows how noisy it is. With so few stations, the model’s edge here is hard to tell from luck. This is where the goal earns its keep. The model narrows the haystack. Getting from there to a site that actually works still takes a closer look at each one, on the ground.
Nearby competition isn’t a dealbreaker. Distance from other stations can matter, but it often doesn’t. In this data, recent builds actually sat a little closer to an existing station than other busy corners did. Stations tend to go where the demand is, and sometimes that means company.
The trained model beat the manual weighting. The hand-built score caught 21% of later builds in its top 10% on realistic corners, less than half of what the trained model managed. I kept it in the blend anyway, and that costs something real: the blend caught 36% in the top 10%, against 46% for the model alone. The reason is what the test can’t see. The hand-built score carries parcel factors like land value and pad size, which the model is kept from seeing to avoid leakage. The test can’t give them credit either, because every past station’s parcel already has a station on it. So the test sees what the hand-built score costs, but never what the parcel factors add. I think they earn their place, but that’s a judgment, not a result.
Not every good idea shows up in the data. I tested two ideas I expected to help. One was rewarding corners at the entrance to a subdivision, where hundreds of homes have to pass to get out. The other was a classic retail gravity model that splits nearby demand among competing stations. Neither improved the test. The subdivision idea may still be right. Few past stations sit at one, so the data can’t confirm it or rule it out. The gravity model made results slightly worse, so it came out.
Looking at the map still matters. Paging through the top of the list on satellite imagery turned up mistakes in my rules that no score would have caught. A busy intersection on a wide six-lane road had all four corners rejected, because the road was so wide that every parcel sat farther from the intersection than my corner rule allowed. Two corners at a subdivision entrance were thrown out because the side street was recorded as its own city-owned parcel, which my access check read as land blocking the driveway. A large tract was excluded for touching the aquifer recharge zone half a mile from the corner where the store would go. And the new number-one site had a pond covering a fifth of it. Each fix was a rule, not a hand edit, so it applied everywhere: fixing the corner rule alone added about 600 qualifying corners, and those four rejected corners now rank near the top of the list.
Reviewing the results
Scores alone don’t make a shortlist. The last step is a review map: a ranked list beside satellite imagery, with filters for site type, county, floodplain and alcohol-sale distance. Click a site and it draws the parcel, the proposed pad, the floodplain, and any schools, churches or child care nearby. Each site also lists the reasons it ranks where it does, along with flags worth checking.
Here’s one example, ranked 64th when I ran it: a 12-acre tract where Turnersville Road meets a TX-45 toll ramp in southeast Travis County. The tract is bigger than a store needs, so the screen carved a 2-acre pad at the corner and confirmed it holds a driveway on both roads.
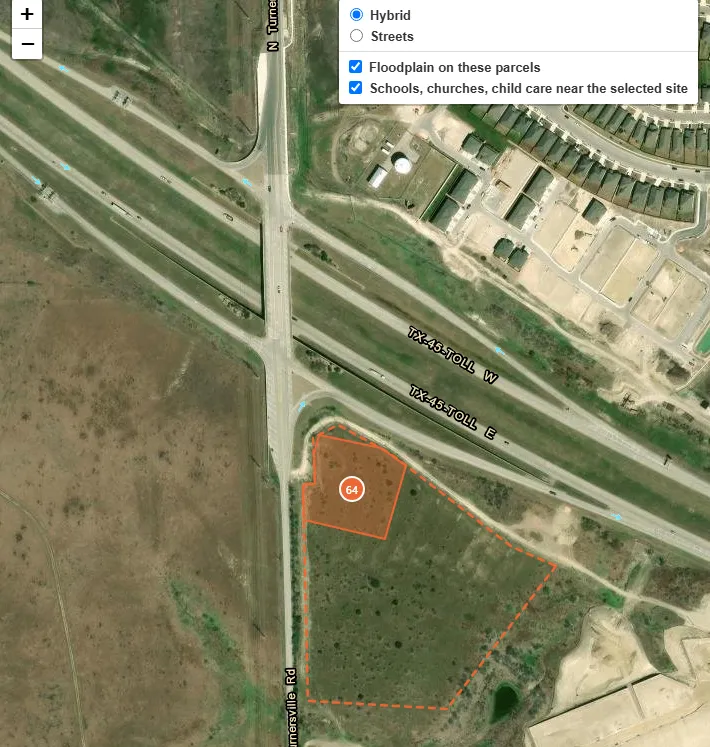
One site in the review tool. The filled shape is the proposed pad and the dashed outline is the full parcel. Owner details are left out.
The flags are as useful as the score. This one would need to be subdivided, has no traffic count on the cross road, and has a driveway on a highway ramp, which TxDOT would need to approve. None of that rules it out. It all goes on the list of things to check.
A few things the review map handles that a pure score doesn’t:
- Alcohol distance. Texas lets cities and counties restrict alcohol sales near churches, schools and public hospitals. Nearby sites rank a little lower but stay on the list, since the legal measurement often runs door to door and can clear where a property-line check doesn’t.
- Stability. Each site carries a measure of how often it stays in the top 50 when the weights are shuffled. Sites that hold up under different assumptions get more confidence.
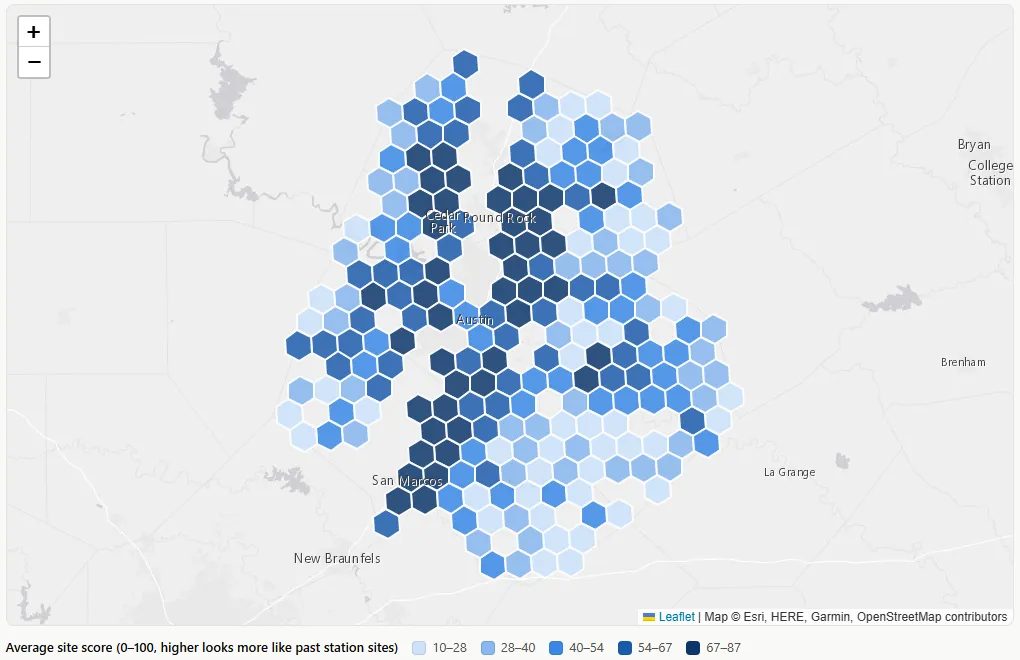
The public version stops at hexagons. Each site’s score runs from 0 to 100 and works roughly like a percentile: a site scoring 70 looks more like past station sites than about 70% of the roughly 2,800 qualifying corners. Each hexagon shows the average for the sites inside it. A dark hexagon is a good area to start looking, but a light one can still hold a strong corner.
Average site score by area. Darker hexagons have higher averages. Individual sites aren’t shown.
What this can’t tell you
- It finds resemblance to past choices, not profit, and past choices include mistakes.
- Of 173 retail fuel facilities with tanks installed since 2019, only 90 could be tied to a corner parcel. Sites on new roads are the hardest to locate.
- Road data reflects today’s roads, which may flatter sites whose roads improved after a store opened.
- The test results were looked at during development, so they’re likely a little optimistic until the frozen ranking can be graded on new stations.
- Most city and county roads have no traffic count. The commute-based estimate fills the gap, but commutes are only part of all driving, so it’s a rough guide.
- Building footprints are a current snapshot. To score past years, a building only counts once satellite land cover shows its lot as developed, which undercounts some rural buildings.
- Mapped water misses some stock tanks, and pond outlines can be off by a few yards. Tiny overlaps are ignored in the score for that reason.
- A high score doesn’t mean a site is for sale, zoned for fuel, or served by utilities.
Where it could go next
There’s plenty of room to improve this. Roughly in the order I’d tackle them:
- Grade the frozen ranking. As stations built after publication show up in the tank registry, check where they landed on the frozen list. That’s the only test nobody tuned against.
- Use roads as they were. Today’s road network flatters older stations whose roads were widened later. Historical road data would remove that bias and show how much of the result it accounts for.
- Better traffic counts. The commute estimate covers every road, but commutes are only part of all driving. More complete traffic data exists, and it would sharpen the score exactly where it’s estimating today.
- More environmental red flags. The Edwards Aquifer, floodplain and ponds are only a start. Wetlands, protected species habitat, known contamination, pipeline and power line easements, and local creek buffers can all rule a site out or make it far more expensive. Screening for them would take more of the dead ends off the list.
- Water and sewer. A corner outside a utility’s service area may need a well and septic system, or a long line extension. That quietly rules out a lot of rural corners. Service area boundaries are public, so this could be a screen.
- Zoning. Several cities publish their zoning maps. Flagging corners where fuel sales would need a rezoning would set expectations early.
- Where demand is heading. The model learns from the past. New subdivisions, building permits, planned schools and scheduled road widenings show where traffic will be in five years, which is when a store built today needs to perform.
- Add what a site visit picks up. Traffic signals at the corner and median openings are the kinds of details that separate two good corners. They’re also where the model is weakest.
- Track local rules. Alcohol-distance ordinances and wet/dry boundaries vary by city and county, and some change by election. Keeping a current table of them would make that flag more reliable.
A good start, not a sure winner. For a shortlist, that’s the point.